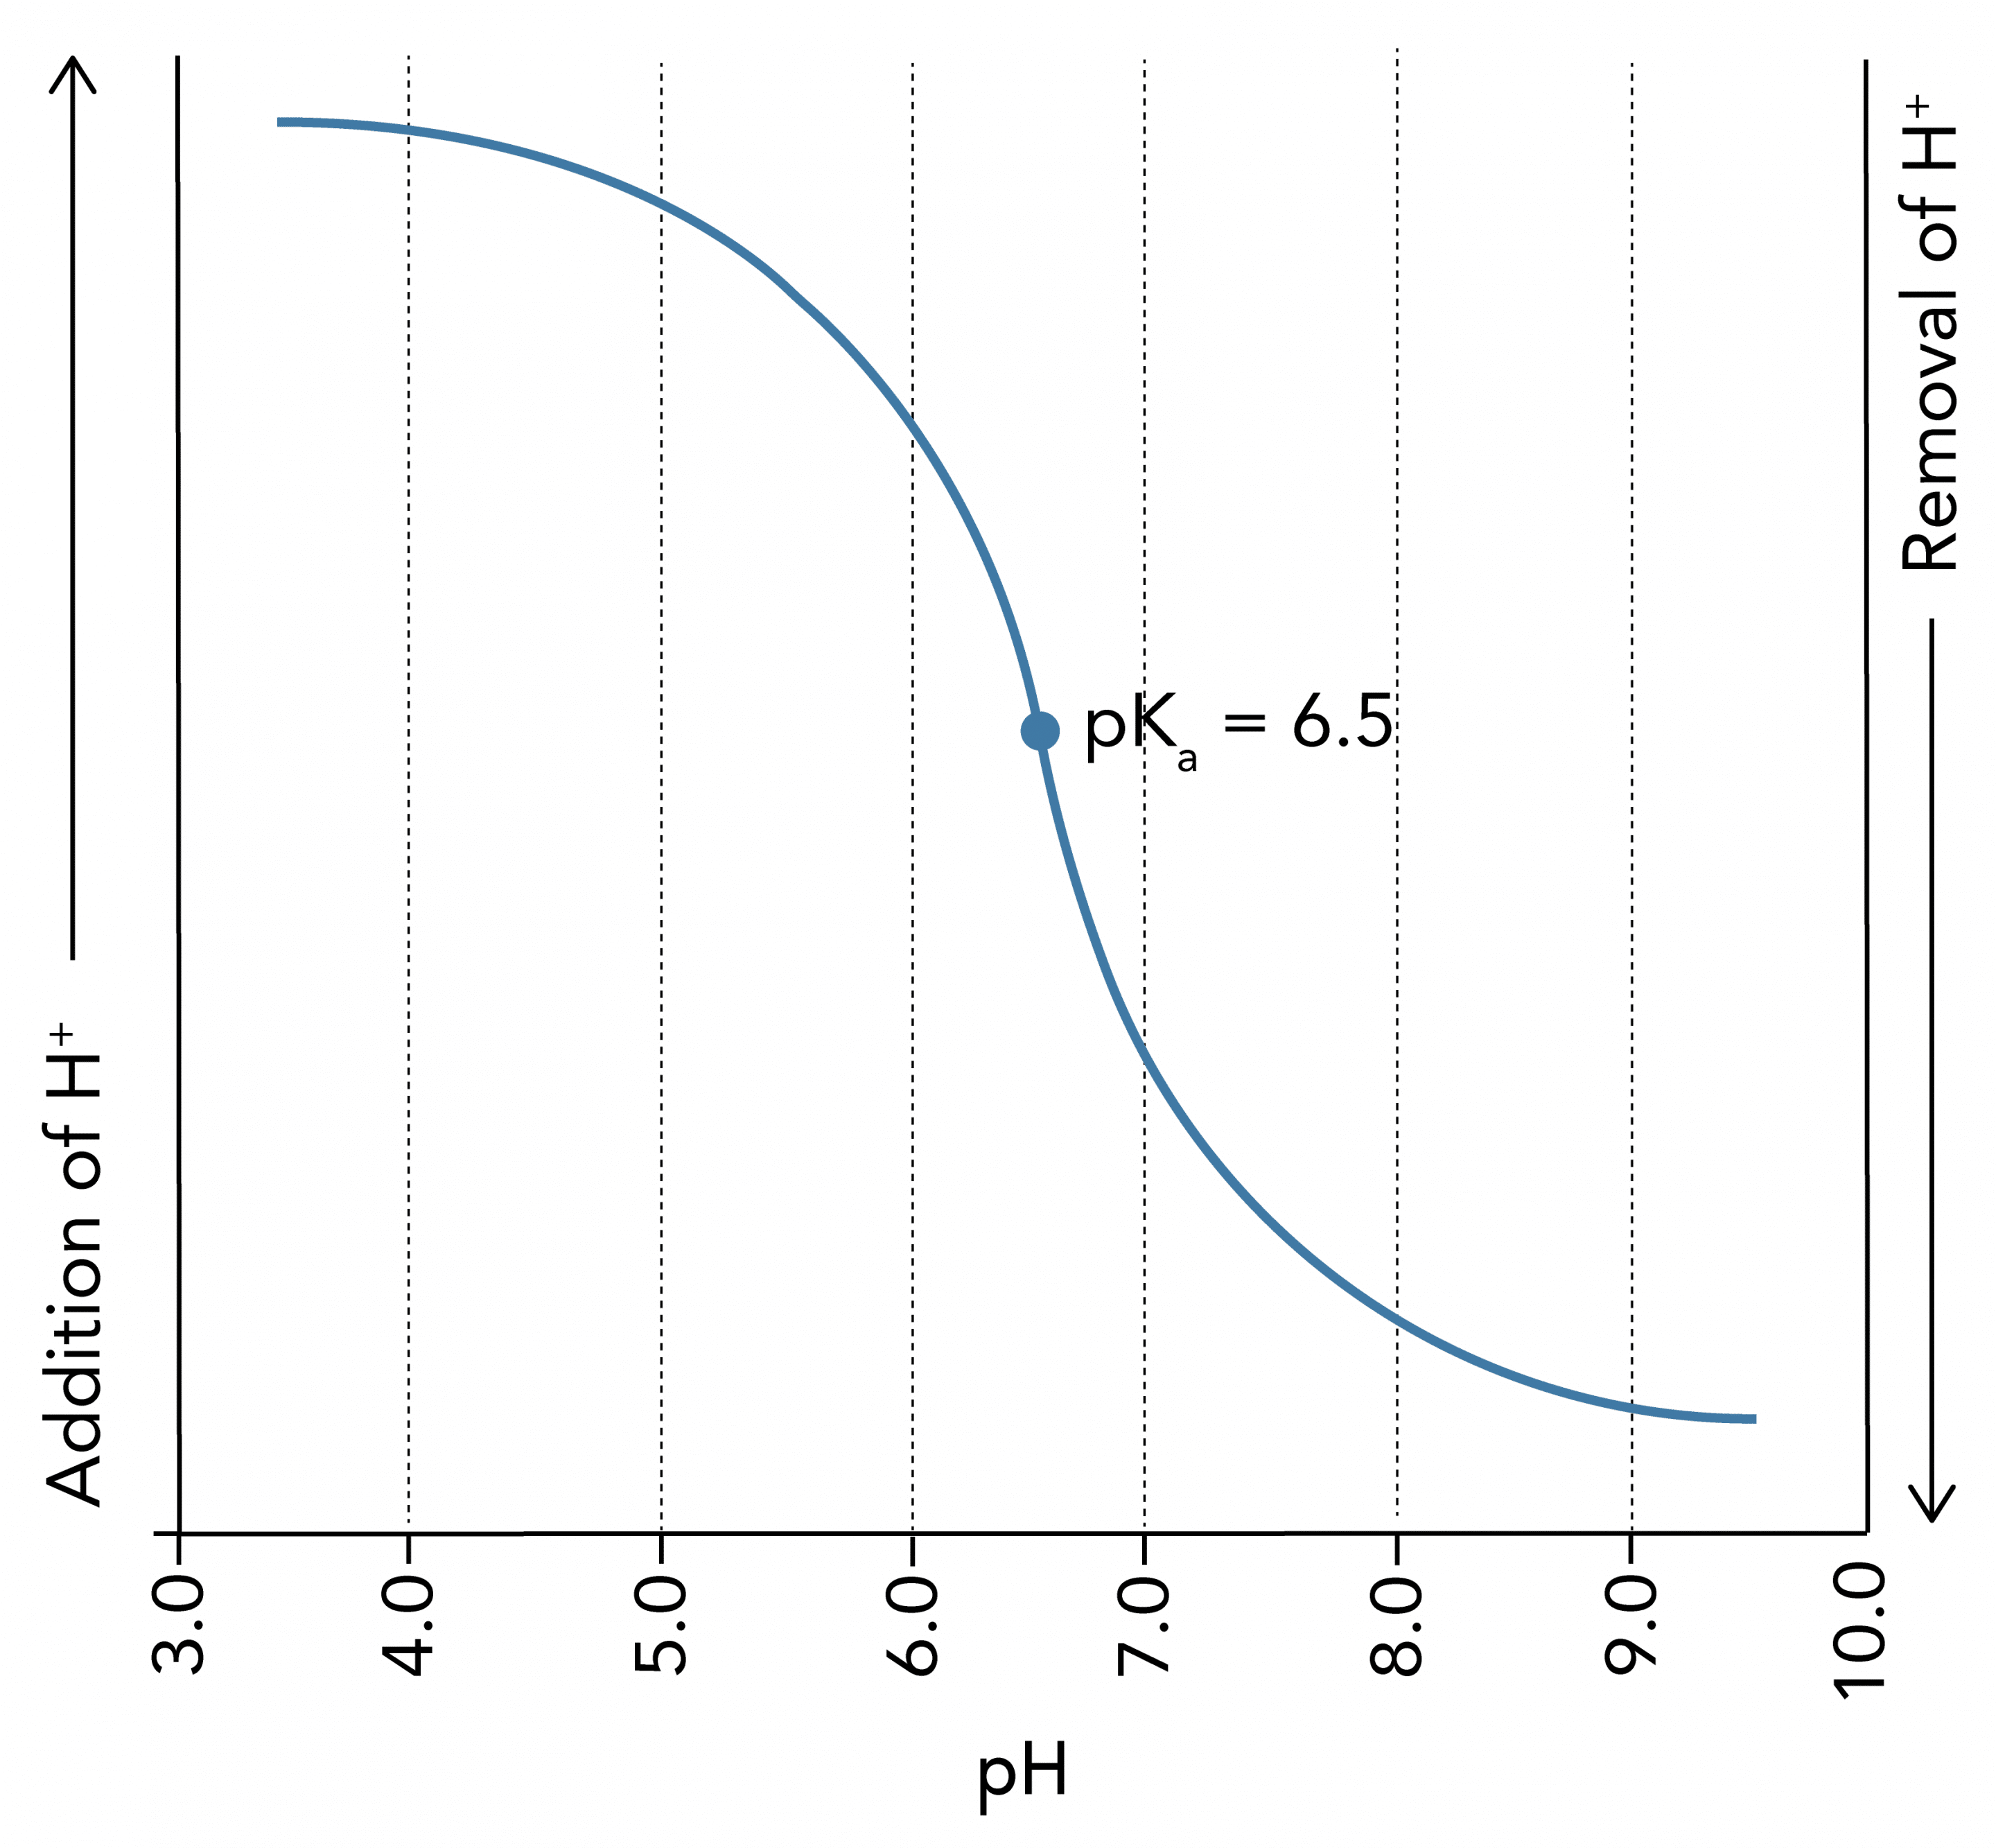
- A titration curve is a visual representation of a buffers effective range
- Plots the pH of the solution against the volume of titrant added
- Has a striking sigmoidal shape:
- In the linear portion, around the buffer’s pH, large changes in H+ result in only small changes in pH – most effective buffering
- Outside the effective buffering range pH changes drastically with small changes in H+ concentration
- Demonstrates the effective buffer range extends 1.0 pH unit above and below the pKa of a buffer
- Below is a titration curve of a weak acid with a pKa of 6.5

