Time: 0 second
Question No. 2
Q: What is the piezoelectric effect?
Answer No. 2
- An effect exhibited by certain quartz crystals (such as lead zirconate titanates) known as 'piezoelectric crystals'
- The piezoelectric crystal will change shape when an electrical potential is applied across it:
- Dimensions change slightly depending upon the polarity of the applied voltage
- Change in shape causes local changes in pressure, leading to mechanical waves (ultrasonic radiation) being generated at the exact frequency of the applied voltage
- The converse effect occurs when pressure is applied to a piezoelectric crystal:
- Compressive stress causes a change in dimensions of the crystal
- Generates an output voltage at the frequency of the compressive waves
- Allows piezoelectric crystals to act as transducers:
- Direct effect converts mechanical energy into electrical energy
- Converse effect converts electrical energy into mechanical energy
Question No. 3
Q: How are ultrasound waves and images generated?
Answer No. 3
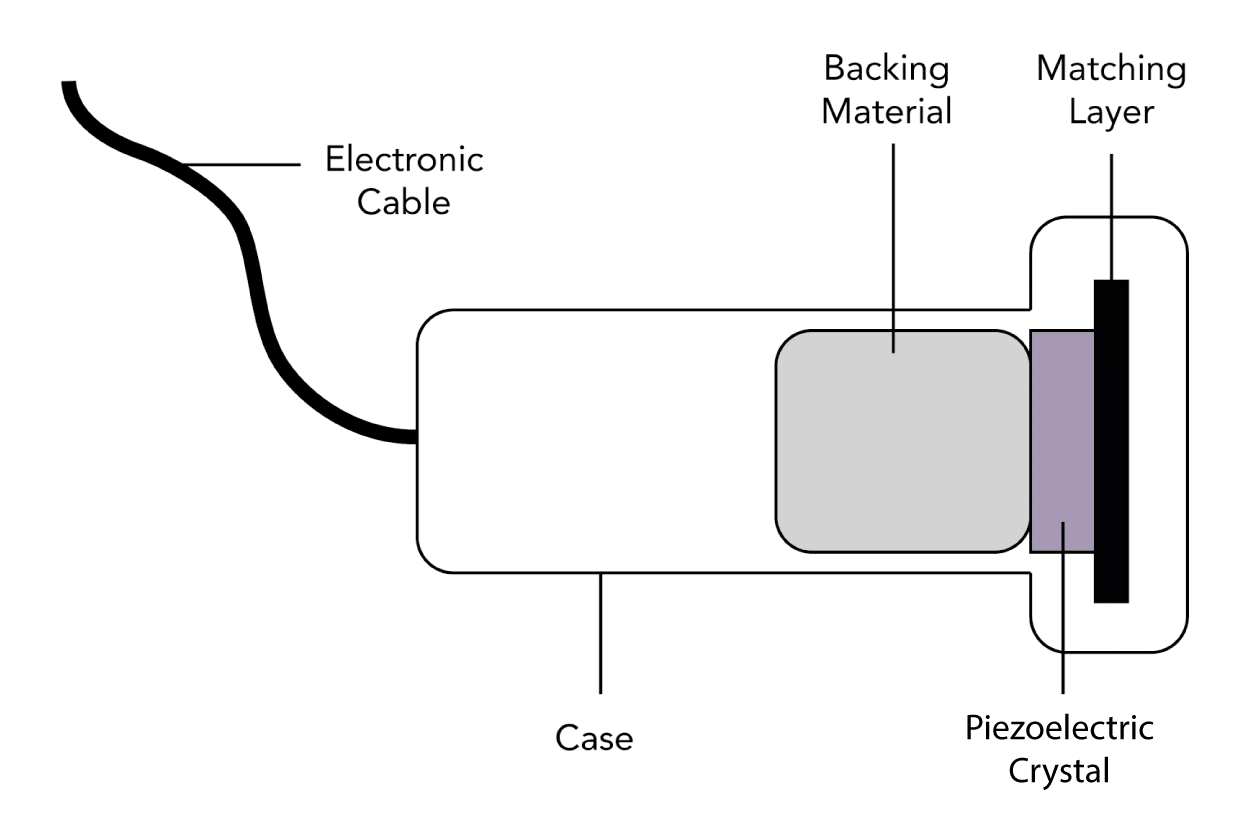
- Ultrasound waves are produced by an ultrasound probe:
- An electric current is passed through a piezoelectric crystal:
- Act as transducers converting electrical energy into mechanical vibrations at high frequencies
- Generates ultrasound waves at the frequency of the voltage applied
- Ultrasound waves travel through a given medium
- When a structure is encountered some waves are reflected back towards the probe
- The probe detects returning waves:
- The pressure effect distorts the piezoelectric crystals producing an output voltage
- Converts the mechanical energy into electrical energy
- Output signals from the probe are then converted into an image:
- The time between the waves being sent out and returning is calculated
- Depth of a structure is determined by the time taken for a wave to return
- Pixels are created at the appropriate depth for returning waves
- The brightness of the pixel correlates with the strength of returning wave
- Multiple crystals are located within a probe:
- Positioned adjacent to each other in an "array"
- Connected electrically to generate a 2D image
- As the ultrasound probe both emits and receives the signal they are known as 'transceivers'.
Question No. 4
Q: Does the transducer produce ultrasound waves continuously?
Answer No. 4
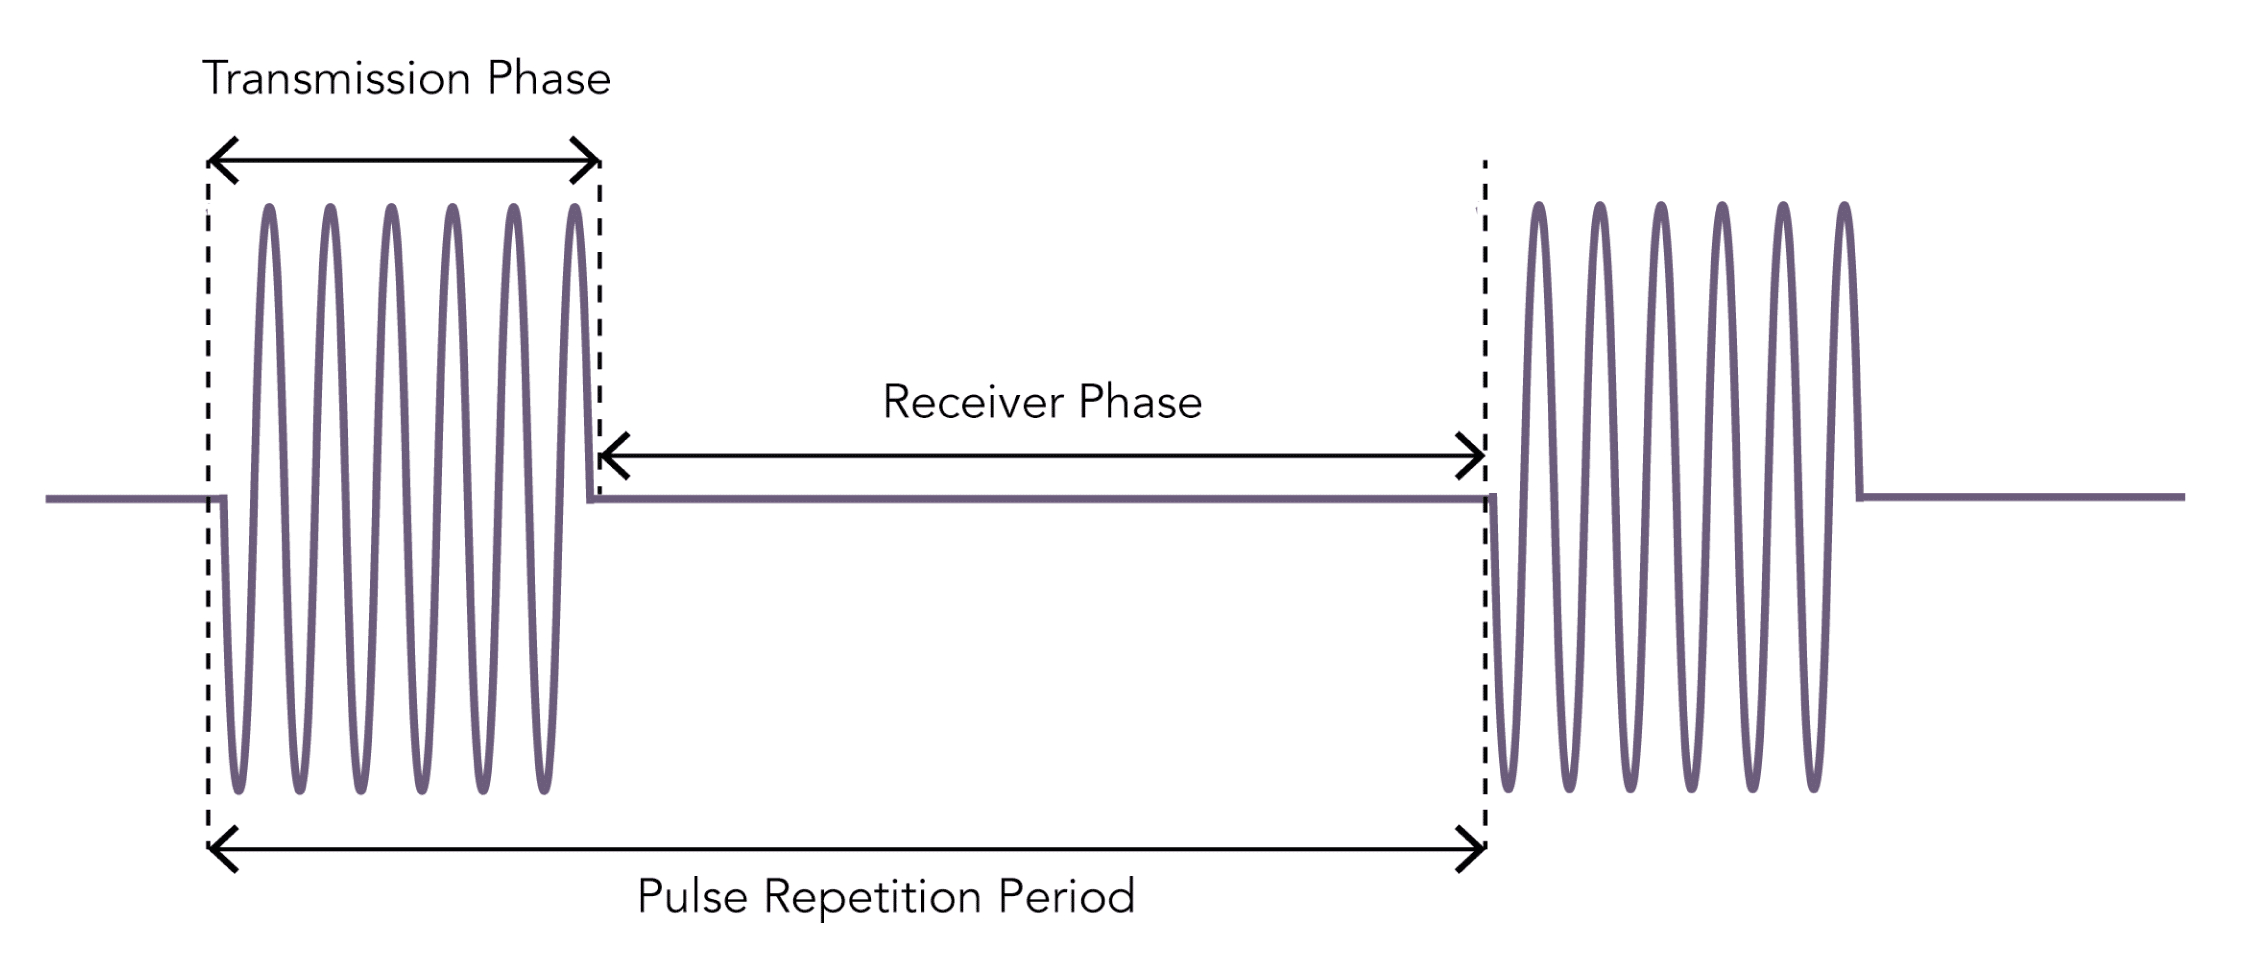
- The transducer alternates through phases of generating and receiving ultrasound waves
- The 'Transmission Phase' is the period of wave generation:
- Usually very brief (0.5–3 μs)
- Followed by a 'Receiver Phase' for wave detection:
- Much longer (up to 1 ms) than the transmission phase
- Allows echoes from a range of depths to be detected
- The combined duration of the transmission and receiver phases is the pulse repetition period:
- Determines the frame rate of an ultrasound generated image
- Shallower depths allows for a shortened receiver phase and thus a higher frame rate
Question No. 7
Q: What types of ultrasound probes are available?
Answer No. 7
- Probes can be characterized according to their:
- Shape
- Arrangement of the piezoelectric crystals
- Frequency range
- Footprint
- In general they are classified as:
Type
Description
Uses
Examples
Linear-Array
- Crystals arranged in a linear fashion
- Flat rectangular footprint which produces a rectangular image
- Generally of high frequency (5-10 MHz) providing good resolution for shallow structures
- A "hockey stick" probe is a linear array probe with a small footprint for use in paediatrics or smaller anatomical areas
- Vascular access
- Superficial nerve blocks (supraclavicular and axillary brachial plexus, forearm, femoral etc.)
- Musculoskeletal imaging
- Pleural imaging
Curvilinear (Convex) Array
- Crystals arranged alongside each other across a curved face
- Produce a sector shaped image with a curved top and bottom
- Generally of lower frequencies (2–5 MHz), allowing for better imaging of deeper structures
- Abdominal and pelvic imaging
- Lung Imaging
- Deep nerve blocks (sciatic, infraclavicular brachial plexus etc.)
Phased Array
- Crystals arranged in a very small cluster
- Has a flat footprint which produces a pie-shaped image
- Generally of lower-frequency (2–8 MHz) allowing imaging of deeper structures
- Small footprint makes it useful for cardiac imaging between ribs
- Echocardiography
Endocavity
- Specialist probes with long handles to scan inside body cavities
- Common examples include: vaginal, anorectal, laparoscopic and oesophageal probes
- Internal imaging (transvaginal, transrectal etc.)
Question No. 8
Q: What are the benefits and uses of high and low-frequency probes?
Answer No. 8
Type
High-Frequency Probes
Low-Frequency Probes
Description
- 6-15 MHz range
- Good resolution (0.5 mm axial and 1.0 mm lateral)
- Reduced penetration (5-6 cm depth of field)
- 2-5 MHz typical range
- Good penetration (5-18 cm depth of field)
- Reduced resolution (2.0 mm axial and 3.0 mm lateral)
Use
- Vascular access
- Superficial nerve blocks (supraclavicular and axillary brachial plexus, forearm, femoral etc)
- Musculoskeletal imaging
- Pleural evaluation
- Abdominal and pelvic imaging
- Lung Imaging
- Deep nerve blocks (sciatic, infraclavicular brachial plexus etc)
- Neuraxial structures
Question No. 9
Q: Which imaging modes can be used with ultrasound?
Answer No. 9
A-Mode
(Amplitude Mode)
(Amplitude Mode)
- Simplest form of imaging using a single wave emitted from the probe
- Scans a line through the body with echoes plotted as a function of depth
- Rarely used in intensive care or anaesthesia
- Used by ophthalmologists to measure the diameter of the eyeball
B-Mode
(Brightness Mode)
(Brightness Mode)
- The most commonly used mode in anaesthesia and intensive care
- Uses a linear array of transducers to produce a line of ultrasound waves
- Ultrasound scans through a section of tissue and is reflected back producing a two-dimensional view
- The intensity of the image generated is proportional to the intensity of reflected echoes received
- Best image is produced when the reflector is at 90° to the ultrasound beam
M-Mode
(Motion Mode)
(Motion Mode)
- Used to show how a structure moves temporally across a single beam of ultrasound
- Plots a rapid sequence of a-mode images over time
- Often used in cardiac or thoracic scanning to show the movement of structures (e.g. heart valve motion)
Doppler Mode
- Utilizes the doppler effect to detect the direction and velocity of flow
- Colour Flow Doppler: displays the direction and magnitude of flow with colour. Blue indicates flow Away from the ultrasound probe and Red indicates flow Towards the probe (BART)
- Duplex Doppler: combines real time color doppler superimposed onto real-time grey-scale b-mode image
Question No. 10
Q: What is the doppler effect?
Answer No. 10
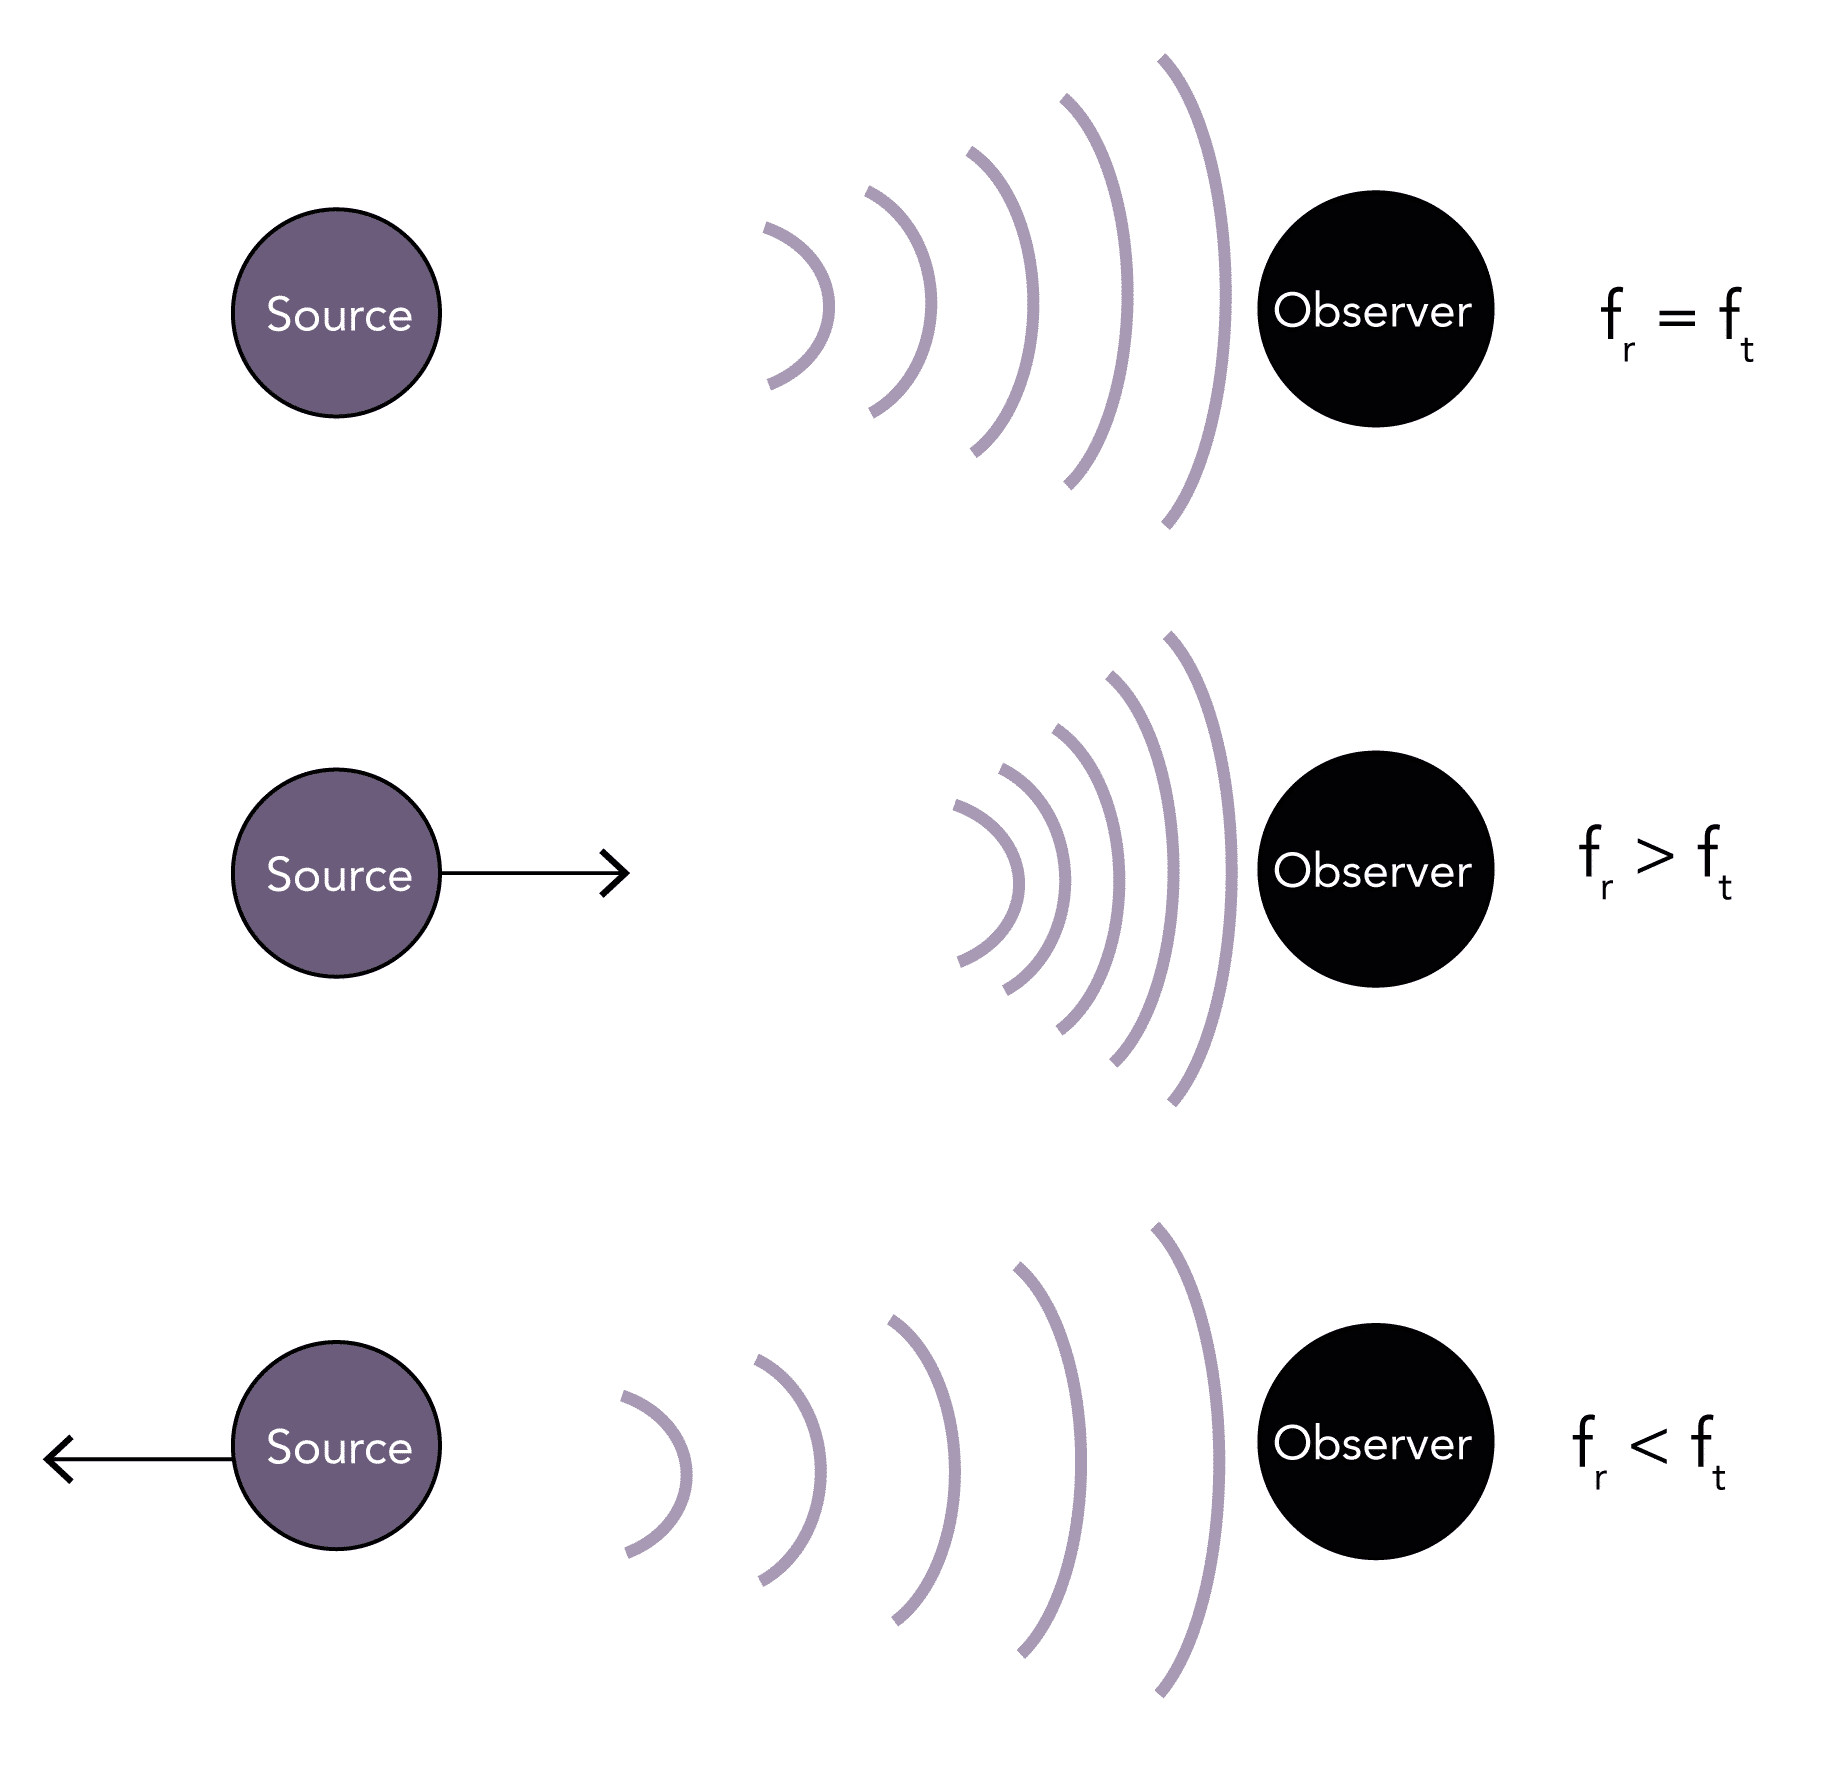
- Describes the change in the transmitted frequency of a sound wave (ft) compared to the reflected (observed) frequency of the wave (fr) that occurs due to the relative motion between the observer and the source
- If the source and the observer are stationary any waves reflected back will be of the same frequency (fr = ft)
- If the source is moving toward the observer it causes waves to be more closely packed together, so the observer witnesses a higher frequency wave (fr > ft)
- Conversely, if the source is moving away from the observer it causes waves to be more loosely packed together, so the observer witnesses a lower frequency wave (fr < ft)
- The change in the observed frequency from that originally transmitted is known as the 'Doppler shift' (fd = fr - ft)
- It is proportional to the relative velocity between the source and the observer
- It does not matter whether it is the source or the observer which is moving
- An example in everyday life is the change in pitch of a siren as a police car passes by
Question No. 11
Q: How is the velocity or magnitude of movement calculated using the doppler effect?
Answer No. 11
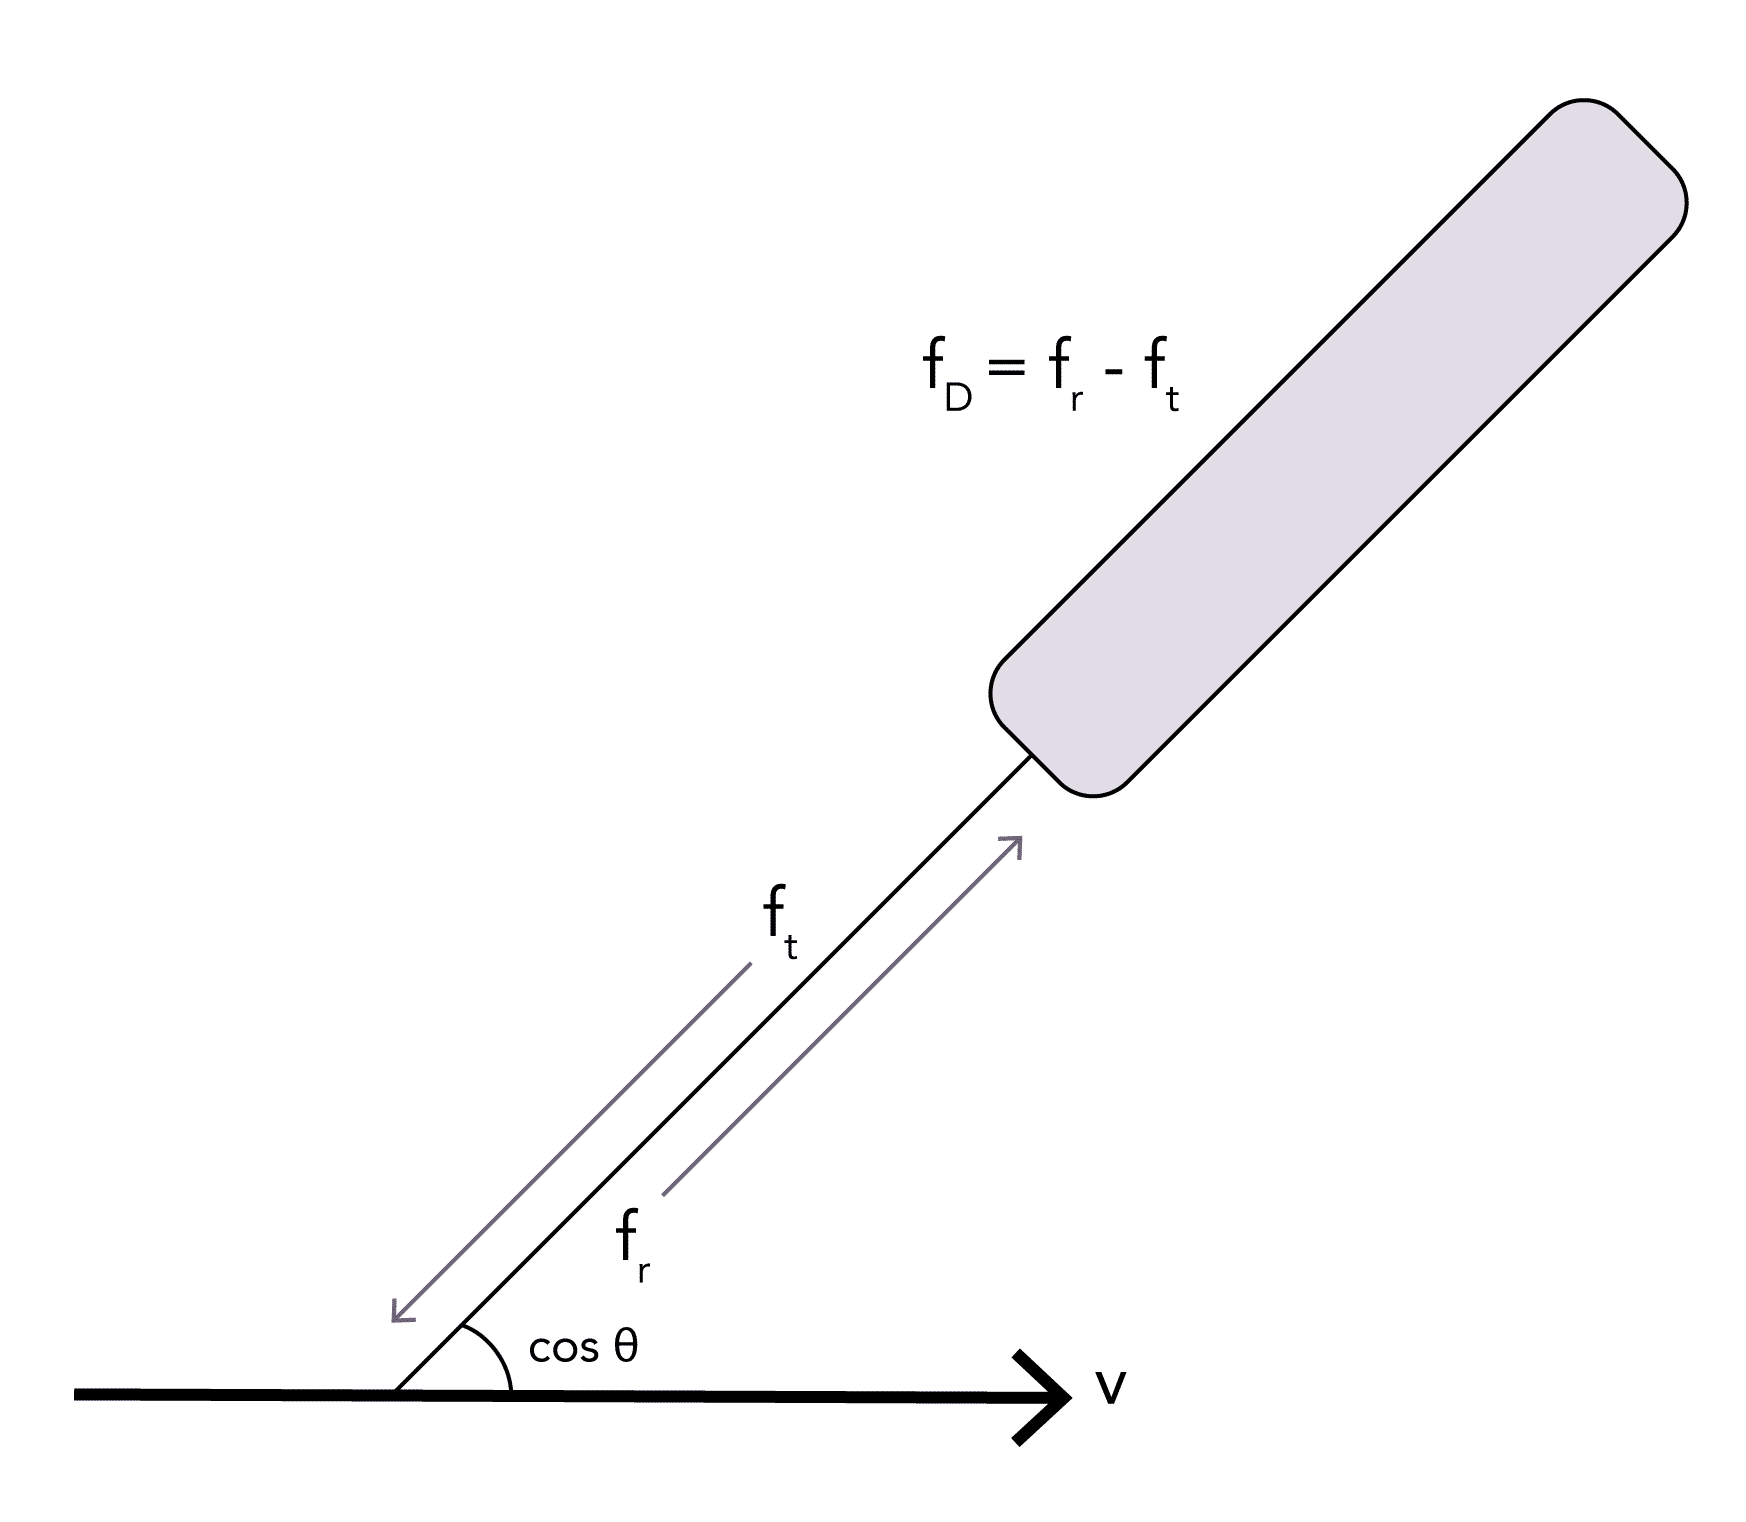
- The detected Doppler shift frequency (fd) can be used to calculate the velocity of an object the waves reflect off using the 'doppler equation':
v = flow velocity (m/s)
c = the speed of sound in tissues (m/s)
fd = Doppler frequency shift that is received (Hz)
cos θ = cosine of the angle between the sound beam and moving fluid (45°)
fT = frequency of the transmitted ultrasound from the transducer (Hz)
c = the speed of sound in tissues (m/s)
fd = Doppler frequency shift that is received (Hz)
cos θ = cosine of the angle between the sound beam and moving fluid (45°)
fT = frequency of the transmitted ultrasound from the transducer (Hz)

Question No. 12
Q: Which features on an ultrasound scanner can be changed to optimise the image?
Answer No. 12
Gain
- Describes the degree of amplification of the reflected signal that is received
- If low gain is used, tissues which are poor reflectors will not be visualised
- If high gain is used noise is added to the image and it can become difficult to delineate different structures
Focus
- The beam possesses a focal point where resolution is highest, much like a camera lens
- This is usually set to an area 2/3rds of the total depth
- The structure of interest should be positioned within the area of greatest focus
Depth
- Optimum depth should always be selected to allow visualisation of the structures without additional areas
- Shallower depth allows for a faster frame rate
Dynamic Range
- Describes the range between the minimum low and maximum high signal intensity that is displayed
- This equates to the contrast that is viewed within the image upon the screen
- Generally a high dynamic range is used to improve the image quality although it may need to be reduced in the presence of "noise"
Sector Width
- Selecting a narrower sector width allows a faster frame rate and increased resolution but with reduced field of view
Frequency
- Can often be changed to increase the resolution depending upon the structures being imaged


